

Analytics & Leads > Reports
Table Widget
Use the Table widget to compare many metrics side by side, broken down by page, variant, country, ad group, and more.
Overview
The Table widget shows several metrics at once. Each metric becomes a column, and your breakdown becomes the rows. Split the rows by up to two groupings, such as page, variant, country, or ad group.
This replaces the need for many widgets that each show a single number. Instead of one Single number widget per page, one Table can show visitors, conversions, and conversion rate for every page in a single place.
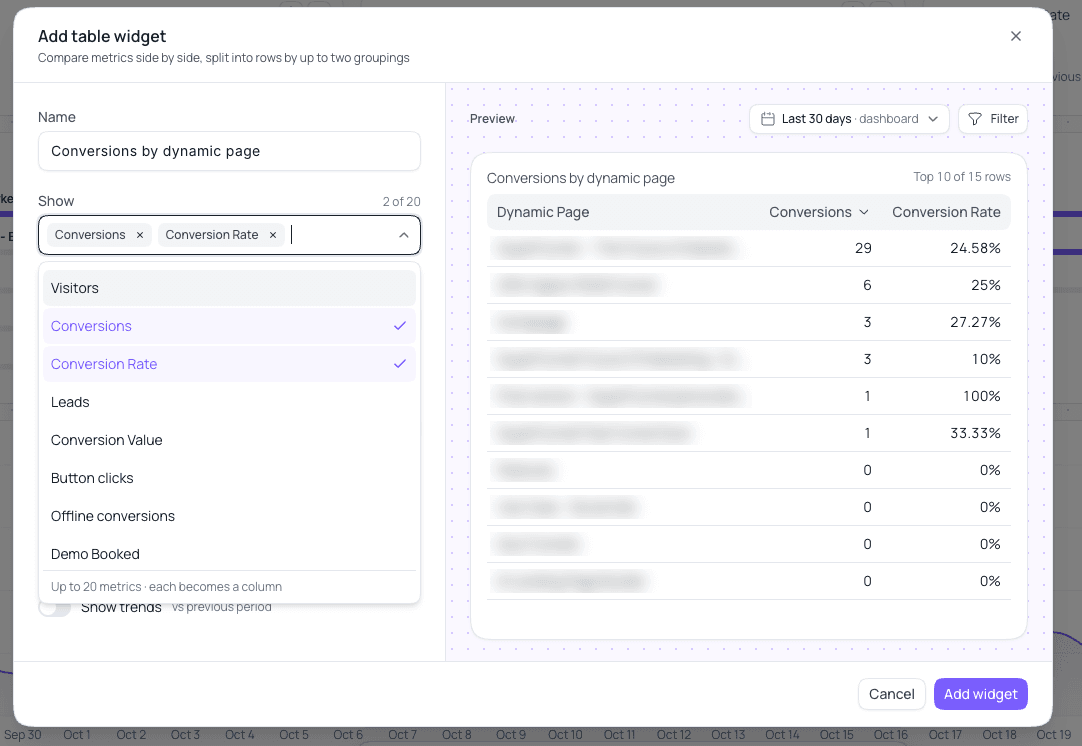
Add a Table Widget
Open Reports and click Edit
Go to Reports and click Edit next to the report selector.
Choose Table
At the bottom of the screen, click + Add widget, then choose Table under Chart.
Name the widget
Give the table a name, for example "Conversions by page".
Pick the metrics in Show
Open the Show dropdown and add the metrics you want to see. Each metric becomes a column, and you can add up to 20.
Pick how to split the rows in By
Choose what each row represents. You can use up to two groupings, such as page and country. The first grouping starts as Dynamic Page.
Set the rows and options
Choose which metric to sort by, how many rows to show, and any options. See below.
Add and save
Check the preview, click Add widget, then click Save in the toolbar to keep your changes.
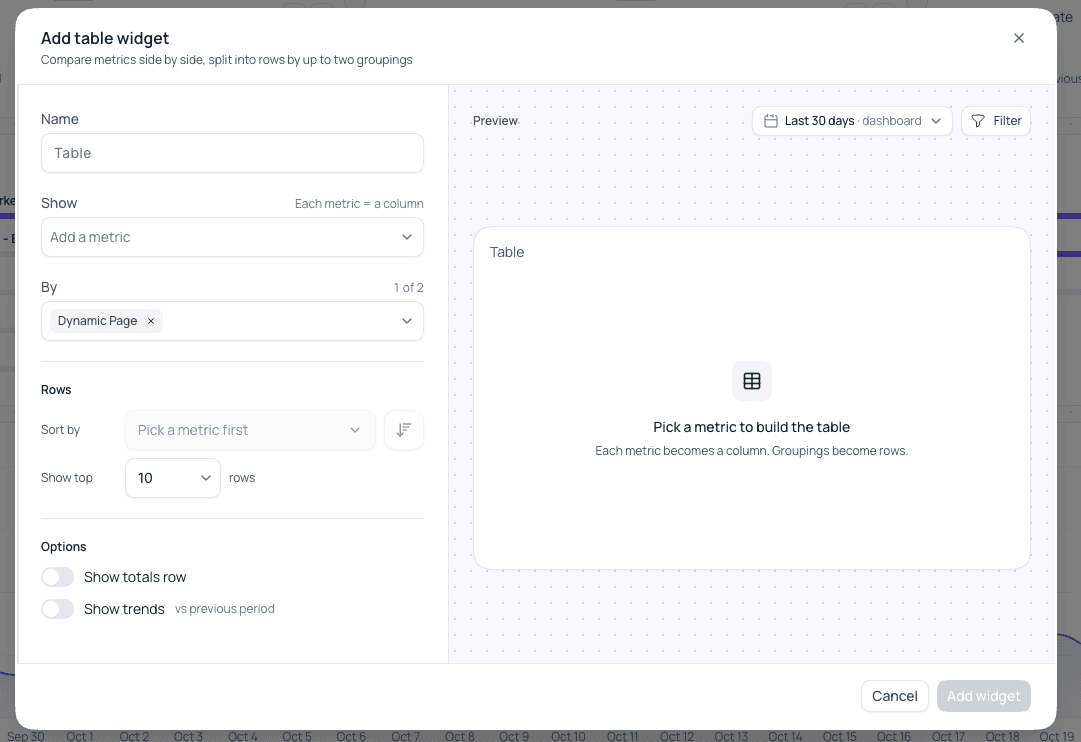
Settings
- Name — the title shown on the widget.
- Show — the metrics, one per column, up to 20. This includes Visitors, Conversions, Conversion Rate, Leads, Conversion Value, Button clicks, and Offline conversions, along with your own conversion events.
- By — the groupings that split the table into rows, up to two. With two, each row is a combination, for example a page within a country.
- Sort by — the metric the rows are ordered by. Pick a metric first, then use the arrow beside it to switch between highest first and lowest first.
- Show top — how many rows to display, 10 by default. The table header tells you how many there are in total, such as "Top 10 of 15 rows".
- Show totals row — add a row at the bottom that adds up each column.
- Show trends — show how each number has changed compared with the previous period.
The preview has its own date range and Filter. By default the table follows the report's date range, like any other widget. See Editing a Widget to pin a different window or add filters.
When to Use a Table
- Compare many pages or variants. One row per page, with visitors, conversions, and conversion rate beside it, shows at a glance which ones are pulling their weight.
- See where results come from. Group by country, traffic source, or ad group to find the segments that convert best.
- Track several conversion events together. Add each event as its own column instead of building a widget per event.
- Keep a report compact. One table can take the place of a whole row of stat tiles.
Use a Single number instead when you only want one headline figure, and a Table when you want to compare.
Let SuperAgent set it up
Describe the table you want, for example "add a table of conversions and conversion rate by page", and SuperAgent can add it to your report for you.
Summary
A Table widget puts many metrics side by side, with rows split by page, variant, country, ad group, or other groupings. Add it from Edit > + Add widget > Table, pick your metrics in Show and your groupings in By, and use it in place of several single-number widgets.