

Analytics & Leads > Reports
Reports
View, filter, and customize Reports, your home for visitor, conversion, and traffic-source analytics.
Overview
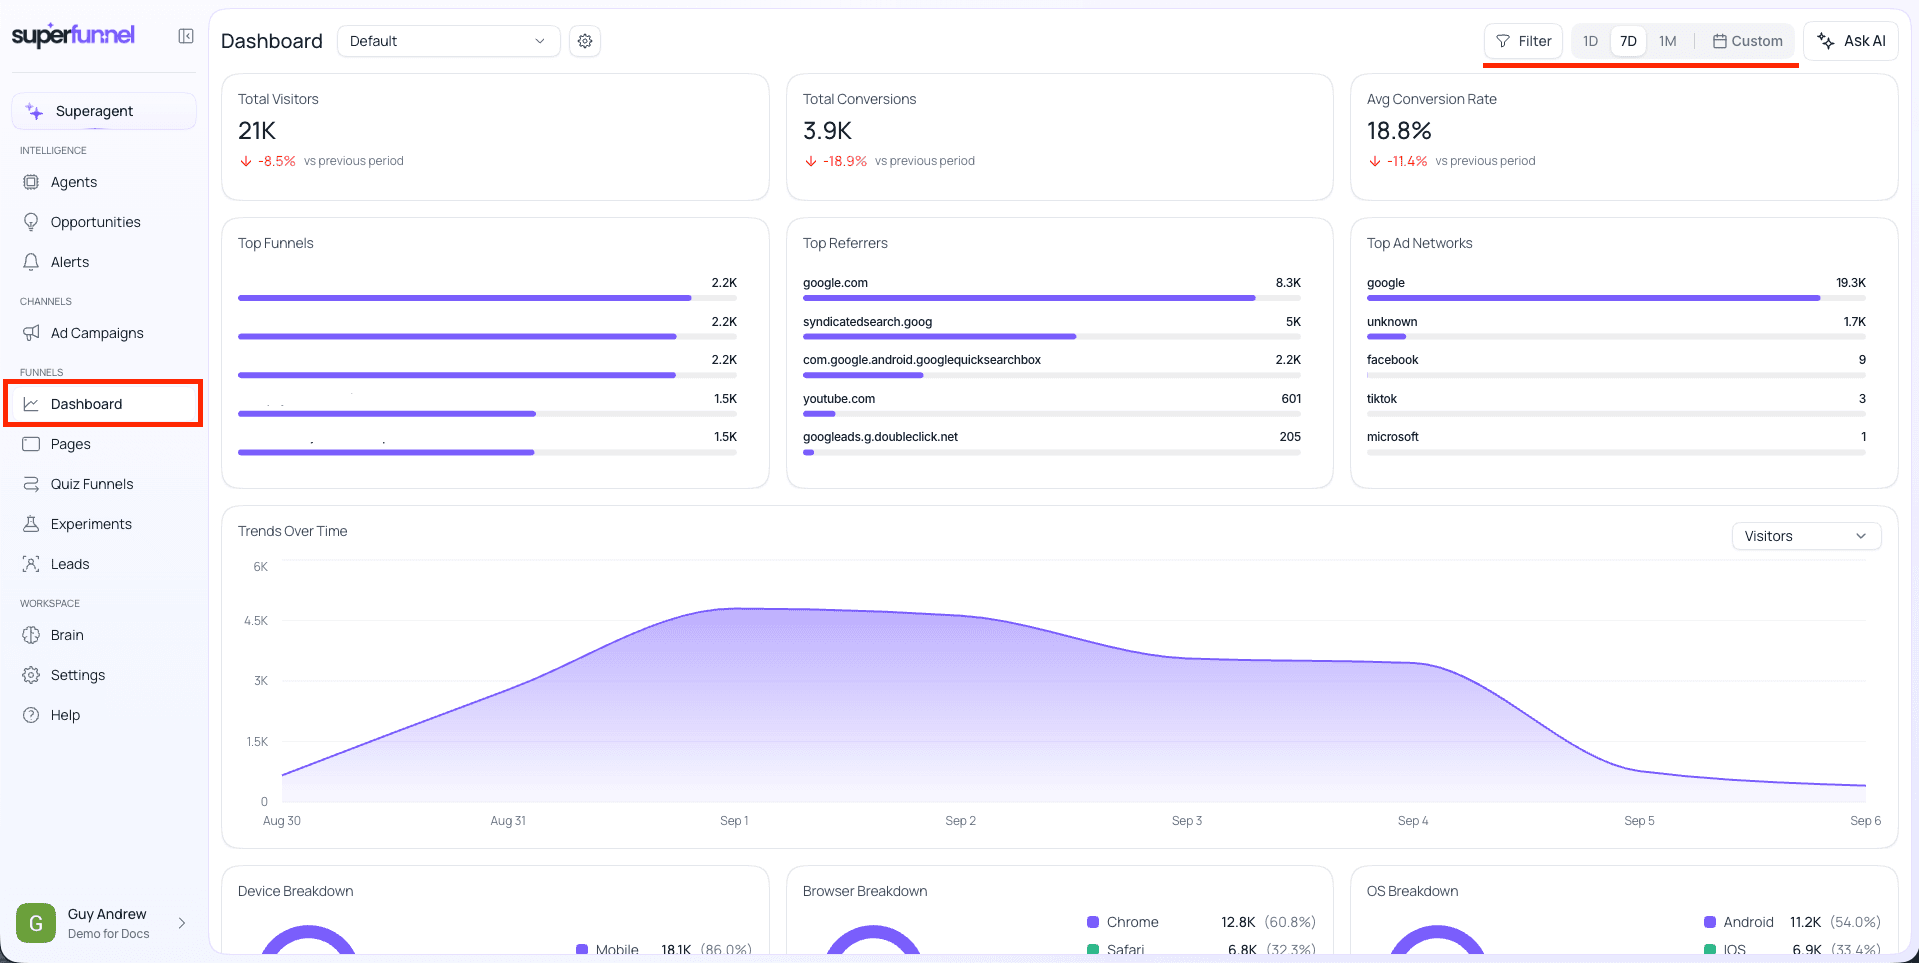
Reports (previously the Dashboard, and before that Overview) is a one-stop-shop for analytics on all your connected ad accounts, including data on ads with non-SuperFunnel landing pages. It also houses data on the progress of all your assets, and with some configuration, your own progress towards your unique goals. It gives you a customizable view of your workspace's performance: visitors, conversions, top traffic sources, trends over time and more.
Each saved layout is called a report. Every workspace starts with a default report, and you can edit it or save your own. Reports are fully customizable, even with options to add text and notes, or resize and move widgets. All features can be handled manually or through SuperAgent.
A report can be viewed and saved at the account default, account, or user (member) level. See Saving Your Changes below.
Each widget compares against the previous period by default, so a red or green text and arrow tells you at a glance whether a number is moving in the right direction.
Build and Edit with AI
Click the SuperAgent mascot in the top right to prompt SuperAgent directly from Reports, in plain language, instead of editing manually. You can ask it to create a new report, or add and edit widgets, for example "add a table of conversions and conversion rate by page for the last 30 days" or "create a report for our Q4 campaign."
Filtering and Date Range
Use the controls at the top right to scope the whole report:
- Filter — narrow every widget down to a specific segment.
- 1D / 7D / 30D / Custom — pick a preset window or a custom date range.
Editing a Report
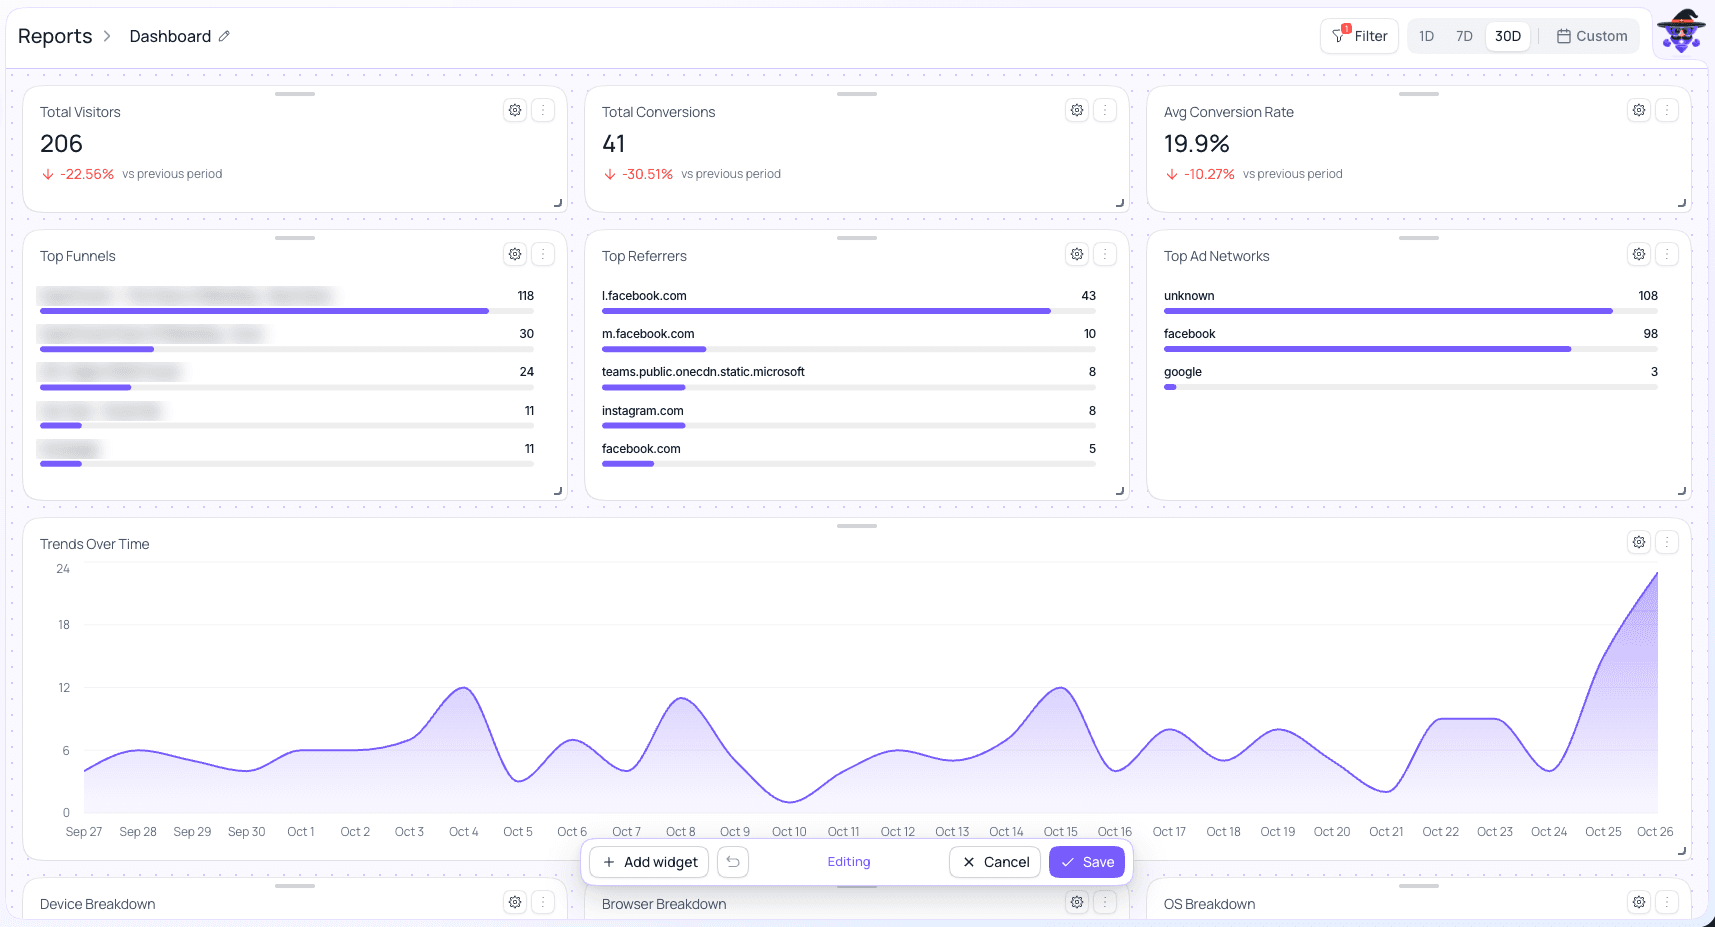
Click Edit next to the report selector to enter edit mode.

In edit mode a toolbar appears at the bottom of the screen with + Add widget, undo, Cancel, and Save. Click the pencil next to the report's name to rename it. From there you can:
- Move a widget — drag the handle at the top of a widget to reposition it.
- Resize a widget — drag its bottom-right corner to make it larger or smaller, up to a full row.
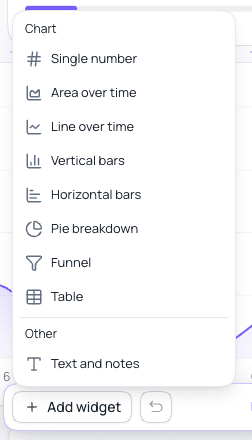
- Add a widget — click + Add widget and choose a chart type: Single number, Area over time, Line over time, Vertical bars, Horizontal bars, Pie breakdown, Funnel, Table, or Text and notes.
- Duplicate or remove a widget — click the ⋮ (vertical ellipsis) on a widget and choose Duplicate or Remove.
- Undo — step back through your changes.
- Cancel — leave edit mode and discard your changes.
Replace several single-number widgets with a Table
If you find yourself adding the same stat tile over and over for different pages, variants, or countries, add one Table widget instead.
Editing a Widget
Individual widgets can also be pinned to their own date range or filter, overriding the report-level controls above.
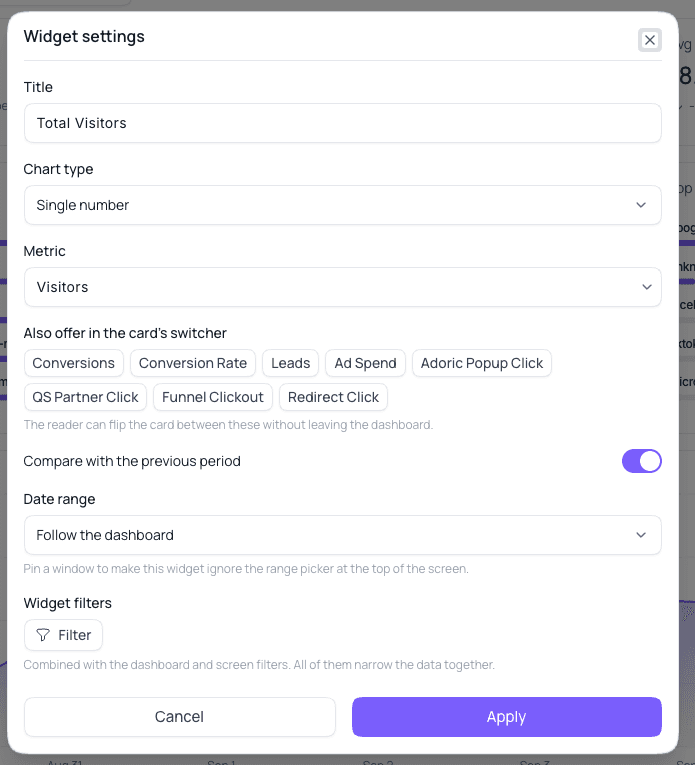
Click the gear icon on a widget to open its settings:
- Title and Chart type
- Metric — the data the widget displays.
- Also offer in the card's switcher — additional metrics (like Conversions, Ad Spend, or a specific event) the reader can flip between on this same card, without leaving the report.
- Compare with the previous period — toggle the period-over-period comparison on or off.
- Date range — leave it set to Follow the dashboard, or pin a fixed window so this widget ignores the top-level date range.
- Widget filters — additional filters for this widget alone, combined with any report or screen filters, all of them narrow the data together.
Saving Your Changes
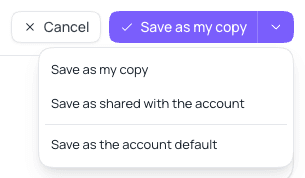
Click Save once you're done editing. Depending on who should see the layout, you can save it at the user, account, or account default level:
- Save as my copy (user level) — only you see this layout.
- Save as shared with the account (account level) — anyone in the account can select this layout from the report dropdown.
- Save as the account default (default account level) — makes this layout what everyone sees by default.
Switching Between Reports
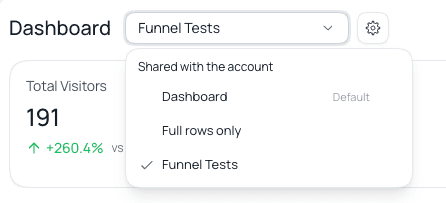
Once you, or a teammate, have saved more than one report, they all appear in the dropdown next to the Reports title, grouped by who they're shared with. Click one to switch the whole screen to that saved layout.
Each report in the dropdown has a ⋮ menu. Use Duplicate to start a new report from an existing one, and Your default dashboard to make a report the one you see first.
Summary
Reports give you a customizable home for your key metrics. Filter and pick a date range at the top for a quick look, or click Edit to resize, add, remove, and reconfigure widgets, then save your layout as a personal copy or roll it out to the whole account.